
“The Small Business Owner Success Puzzle Solution” is a proven coaching and training system spanning four decades, featuring high-profile small business financial coaching and tools that emphasize actionable financial plans, systems and controls for mastering growth and profit results
Small Business Mastery–Financial Fundamentals–Profit Growth Optimization

How Top Small Business Owners Transformed Their Finances, Reduce Costs, Doubled Profits in 90-180 Days
They Get High-Performance Financial Success Puzzle Solutions
Competition is global, life is fast-paced, and the speed of change is accelerating every day. Solution: Get the experience and tools to help you navigate your financial future!
Request America’s premier coaching, mentoring and training. For over 40 years Professor Michael Kissinger has helped thousands of people and small business owners solve their personal, professional, business, financial and organizational challenges.
Did you know that financial clarity accounts for almost 80% of your business success and happiness? It’s true. A lack of financial clarity is probably more responsible for your frustration and underachievement than any other single factor.
Since 1980 Professor Michael Kissinger and Reitenbach Kissinger Institute are dedicated to helping small business owners, managers and entrepreneurs attain financial success. Their work often involves executive financial management coaching, training and development programs that focus on leadership, financial strategy, success psychology and more.
They’ll show you how to assemble top financial controls, boost profits, reduce costs and communicate effectively Improve finances, develop perceptive leaders, streamline operations, retain talent, Increase profits up to 75% and much more.
While they frequently writes about solving complex executive business problems and fine-tuning operations, they typically addresses these topics within their established library of articles and coaching rather than through a single publication under the specific title of “The Small Business Financial Puzzle Solution.”
Core Business Wisdom
Their approach to finances and business growth is defined by timeless and practical advice that aims to help small business owners at all levels to achieve their priorities and achieve their full potential.
Executives and small business owners often seek out their coaching, articles and guides to gain actionable steps for overcoming financial challenges, procrastination and increasing organizational efficiency.
Michael’s philosophy remains consistent across various media, emphasizing that developing the mindset and skill sets necessary for independence is the key to lasting executive, business owner, financial and professional achievement.
Michael’s coaching, mentoring and teaching style remains focused on providing clear, applicable executive and small business financial blueprints for business and financial success that can be implemented immediately in one’s personal and business life.

The Successful Small Business Owners or Managers Business Financial Puzzle Solutions Guide
Start Solving the Business Financial Puzzle, Setting and Achieving
Your Biggest Financial Goals!
Small Business Owners or Managers Success Puzzle Solutions Guide Designed to Increase Profits and Reduce Operational Costs while Simultaneously Driving Up Productivity and Profit Margins.
Professor Kissinger provides small business owners with a Proven Success Puzzle Solutions Guide for business financial success. He is dedicated to helping you reach your business financial goals and achieve success in all areas of your business or life.
This “Small Business Owner Financial Puzzle Guide” provides proven methods on a variety of business finance topics, like business development, marketing and sales coaching, leadership growth, time management, and setting smart goals solutions that will help you get you where you want in life or business.
The Small Business Success Puzzle Ratings for Maximum Profitability
Take the Financial Puzzle Rating Assessment to Determine Your Business Success
The 15 most important small business financial success puzzle formulas. They are broken down by what they measure and why they matter to your bottom line.
[A]: On a Scale of 1 to 10 Rate Your Small Business with these Profitability Formulas
1. Gross Profit Margin Formula: (Total Revenue - Cost of Goods Sold) / Total Revenue x 100
- What it does: Measures the percentage of revenue left after paying for direct production costs. Why it is important: Shows if your products or services are priced correctly and sustainably.
2. Net Profit Margin Formula: Net Income / Total Revenue x 100
- What it does: Calculates how much actual profit each dollar of revenue generates after all expenses. Why it is important: Indicates the overall operational efficiency and health of your entire business.
3. Return on Investment (ROI) Formula: (Net Profit from Investment / Cost of Investment) x 100
- What it does: Evaluates the efficiency or profitability of a specific investment. Why it is important: Helps you decide whether to repeat, scale, or cut specific business expenditures.
[B]: On a Scale of 1 to 10 Rate Your Small Business with these Liquidity & Cash Flow Formulas
4. Current Ratio Formula: Current Assets / Current Liabilities
- What it does: Measures your ability to pay short-term obligations due within one year. Why it is important: Lenders use this to see if your business risks running out of cash.
5. Quick Ratio (Acid-Test) Formula: (Cash + Marketable Securities + Accounts Receivable) / Current Liabilities
- What it does: Gauges short-term liquidity without relying on selling inventory. Why it is important: Provides a strict look at cash health during sudden market drops.
6. Operating Cash Flow Ratio Formula: Operating Cash Flow / Current Liabilities
- What it does: Shows how well regular daily cash generation covers current debts. Why it is important: Proves whether your business sustains itself or relies on outside funding.
[C]: On a Scale of 1 to 10 Rate Your Small Business with these Efficiency Formulas
7. Inventory Turnover Ratio Formula: Cost of Goods Sold / Average Inventory
- What it does: Tracks how many times your business sells and replaces inventory over a period. Why it is important: Highlights overstocking issues or tied-up cash that could be used elsewhere.
8. Accounts Receivable Turnover Formula: Net Credit Sales / Average Accounts Receivable
- What it does: Measures how quickly your business collects cash from clients buying on credit. Why it is important: Low speed indicates collection issues, which tightly chokes your available cash.
9. Accounts Payable Turnover Formula: Cost of Goods Sold / Average Accounts Payable
- What it does: Quantifies how rapidly your business pays off its supplier invoices. Why it is important: Helps balance keeping good vendor relationships with maintaining your cash reserves.
[D]: On a Scale of 1 to 10 Rate Your Small Business with these Break-Even & Growth Formulas
10. Break-Even Point (Units) Formula: Fixed Costs / (Sales Price per Unit - Variable Cost per Unit)
- What it does: Calculates the exact sales volume needed to cover all business expenses. Why it is important: Establishes the absolute minimum baseline sales goals your team must hit.
11. Customer Acquisition Cost (CAC) Formula: Total Marketing & Sales Costs / Number of New Customers Acquired
- What it does: Tracks the average amount of money spent to get one new customer. Why it is important: Keeps marketing budgets realistic and prevents unprofitable, over-expensive sales campaigns.
12. Customer Lifetime Value (LTV) Formula: Average Value of a Purchase x Number of Repeat Purchases x Average Customer Lifespan
- What it does: Estimates the total net revenue a single customer generates over time. Why it is important: Dictates how much you can afford to spend on marketing to stay profitable.
[B]: On a Scale of 1 to 10 Rate Your Small Business with these Leverage & Risk Formulas
13. Debt-to-Equity Ratio Formula: Total Liabilities / Total Shareholders' Equity
- What it does: Compares how much your business relies on debt versus its own equity. Why it is important: High ratios flag risk to investors, showing you might struggle if sales drop.
14. Operating Leverage Formula: Percentage Change in EBIT (Earnings) / Percentage Change in Sales
- What it does: Illustrates how a change in sales volume impacts your overall operating income. Why it is important: Helps you understand your risk profile regarding high fixed overhead costs.
15. Debt Service Coverage Ratio (DSCR) Formula: Net Operating Income / Total Debt Service (Principal + Interest Payments)
- What it does: Assesses your company’s ability to cover its current debt payments with income. Why it is important: This is the primary metric banks review when approving business loans.

The Small Business Success Puzzle Ratings for Maximum Cost Reduction
Take the Cost Reduction Puzzle Rating Assessment to Determine Your Success
15 most important small business cost reductions, what they calculate, and why they matter. They are broken down by what they measure and why they matter to your bottom line.
Small business financial cost reductions typically target the largest controllable line items like labor, production, and administrative overhead to protect cash flow and improve overall profitability.
By identifying and eliminating waste, business owners can create a leaner operation that is better positioned for sustainable long-term growth.
How do I accurately calculate my business break-even point today?
| Cost Reduction Strategy | Calculation Basis | Why It Matters |
|---|---|---|
| Renegotiate vendor contracts | Compare current rates against market averages | Secure better pricing and favorable payment terms |
| Hire internationally | Analyze wage differentials across regions | Access highly skilled talent at lower rates |
| Automate repetitive tasks | Measure time saved against software costs | Reduce manual labor and operational error rates |
| Restructure business debt | Calculate interest savings from refinancing | Improve cash flow by decreasing monthly payments |
| Strategic outsourcing | Compare service fees to internal labor costs | Focus internal resources on core competencies |
Operational Efficiency Gains
Optimizing day-to-day operations allows a business to maintain quality while reducing unnecessary expenditures. These strategies focus on streamlining workflows and minimizing wasted resources, ensuring that every dollar spent contributes directly to productivity or revenue protection.
- Updated technology investments streamline complex workflows, automate manual tasks, and lower long-term maintenance costs for IT infrastructure.
- Zero-based budgeting methods challenge traditional spending patterns by requiring justification for every expense, preventing wasteful allocations.
- Reduced employee turnover saves capital otherwise spent on recruitment, onboarding, and training programs, creating a more stable workforce.
- Consolidated insurance policies eliminate duplicate coverage, which helps avoid over-insurance and lowers total premiums paid to providers.
Financial and Procurement Tactics
Smart management of your procurement and debt obligations provides the foundation for a healthy financial roadmap. By focusing on contract optimization and rigorous expense forecasting, you ensure that your resources are used efficiently without sacrificing the long-term health of your company.
- Procurement cost reductions of 10-25% are often achievable within 6-12 months through consistent vendor performance monitoring and volume-based discounting.
- Business debt management prevents excessive interest accumulation, which preserves borrowing capacity and keeps your business credit rating strong.
- Rigorous budget planning aligns your financial targets with strategic objectives to ensure that resource allocation remains disciplined throughout the fiscal year.
- Performance monitoring metrics track delivery times and quality scores, ensuring that your long-term partnerships provide optimal value.
Every dollar successfully saved in operating costs creates a direct, positive impact on your company’s bottom line.
Here are the 15 most important financial cost reduction formulas for small businesses, what they calculate, and why they matter.
[A]: On a Scale of 1 to 10 Rate Your Small Business with these Cost and Expense Formulas
1. Cost of Goods Sold (COGS) Formula: \(\text{COGS} = \text{Beginning Inventory} + \text{Purchases} – \text{Ending Inventory}\)
- What it does: Calculates the direct costs tied to producing your goods or services. Why it is important: It shows your core production expenses so you can find ways to lower material or labor waste.
2. Operating Expense Ratio (OER) Formula: \(\text{OER} = \frac{\text{Operating Expenses}}{\text{Revenue}}\)
- What it does: Measures how much of your total revenue goes toward daily operational costs. Why it is important: A lower ratio means your day-to-day spending is efficient and leaves more room for profit.
3. Break-Even Point (Units) Formula: \(\text{Break-Even Units} = \frac{\text{Fixed Costs}}{\text{Sales Price per Unit} – \text{Variable Cost per Unit}}\)
- What it does: Finds the exact number of products you must sell to cover all costs. Why it is important: It sets a clear sales target and highlights how cutting fixed or variable costs lowers your risk.
4. Labor Cost Percentage Formula: \(\text{Labor Cost \%} = \frac{\text{Total Labor Cost}}{\text{Total Revenue}} \times 100\)
- What it does: Tracks the percentage of sales spent on payroll and employee benefits. Why it is important: Labor is often the highest business cost; this metric helps you optimize scheduling and staffing levels.
5. Inventory Turnover Ratio Formula: \(\text{Inventory Turnover} = \frac{\text{COGS}}{\text{Average Inventory}}\)
- What it does: Shows how many times you sell and replace stock over a specific period. Why it is important: High turnover reduces storage fees and stops cash from getting trapped in unsold goods.
[B]: On a Scale of 1 to 10 Rate Your Small Business with these Profitability and Margin Formulas
6. Gross Profit Margin Formula: \(\text{Gross Margin} = \frac{\text{Revenue} – \text{COGS}}{\text{Revenue}} \times 100\)
- What it does: Measures profit left over after paying direct production costs. Why it is important: It reveals if your core pricing and production costs leave enough money to pay overhead.
7. Net Profit Margin Formula: \(\text{Net Margin} = \frac{\text{Net Income}}{\text{Revenue}} \times 100\)
- What it does: Calculates the final percentage of revenue turned into actual profit after all expenses. Why it is important: It gives the ultimate health check on whether your total cost-cutting efforts are working.
8. Contribution Margin Formula: \(\text{Contribution Margin} = \frac{\text{Revenue} – \text{Variable Costs}}{\text{Revenue}}\)
- What it does: Shows how much an individual product line contributes to covering fixed costs. Why it is important: It helps you spot and drop unprofitable products or services that drain resources.
[C]: On a Scale of 1 to 10 Rate Your Small Business with these Efficiency and Return Formulas
9. Return on Investment (ROI) Formula: \(\text{ROI} = \frac{\text{Net Profit}}{\text{Cost of Investment}} \times 100\)
- What it does: Measures the financial gain or loss generated relative to money spent. Why it is important: It stops you from wasting money on low-performing marketing campaigns, software, or equipment.
10. Customer Acquisition Cost (CAC) Formula: \(\text{CAC} = \frac{\text{Total Sales and Marketing Costs}}{\text{Number of New Customers Gained}}\)
- What it does: Calculates the exact price tag to win a single new customer. Why it is important: Lowering CAC improves marketing efficiency and protects your cash flow.
11. Customer Lifetime Value (LTV) Formula: \(\text{LTV} = \text{Average Purchase Value} \times \text{Purchase Frequency} \times \text{Customer Lifespan}\)
- What it does: Estimates total revenue a single customer brings over their entire relationship with you. Why it is important: Comparing LTV to CAC ensures your customer acquisition spending makes long-term financial sense.
[D]: On a Scale of 1 to 10 Rate Your Small Business with these Cash Flow and Debt Formulas
12. Cash Conversion Cycle (CCC) Formula: \(\text{CCC} = \text{Days Inventory Outstanding (DIO)} + \text{Days Sales Outstanding (DSO)} – \text{Days Payable Outstanding (DPO)}\)
- What it does: Tracks the time it takes to convert cash investments in inventory into cash inflows from sales. Why it is important: A shorter cycle frees up trapped cash so you need less short-term borrowing.
13. Burn Rate (Net) Formula: \(\text{Net Burn Rate} = \frac{\text{Starting Cash Balance} – \text{Ending Cash Balance}}{\text{Number of Months}}\)
- What it does: Measures how fast your business spends its cash reserve. Why it is important: It tells you how many months your business can survive before running out of money if costs stay high.
14. Debt-to-Equity Ratio Formula: \(\text{Debt-to-Equity} = \frac{\text{Total Liabilities}}{\text{Total Shareholders’ Equity}}\)
- What it does: Compares total borrowed money to owner investment. Why it is important: High ratios mean heavy interest payments, signaling a need to cut debt servicing costs.
15. Overhead Rate Formula: \(\text{Overhead Rate} = \frac{\text{Total Indirect Costs}}{\text{Total Direct Costs}}\)
- What it does: Shows how much indirect cost (like rent and utilities) is required for every dollar of direct production cost. Why it is important: It guides realistic product pricing and highlights bloated administrative expenses.
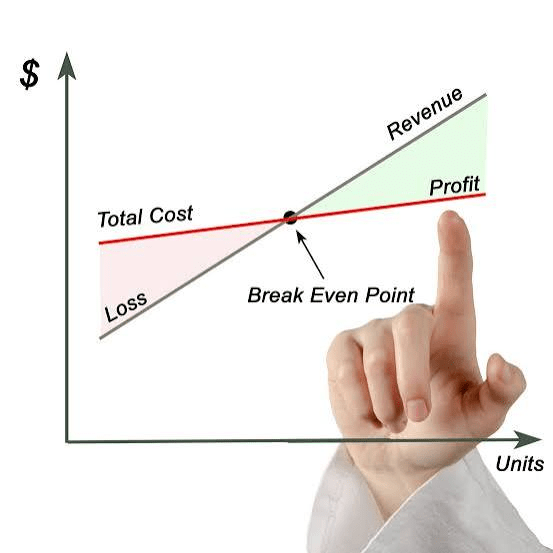
Accounts for Maximum Profit Analysis
1. Profitability Ratios 2. Operating Expenses 3. Liquidity Metrics 4. Solvency Ratios 5. Activity Ratios
Strategic Financial Pillars
1. Profitability Benchmarks 2. Operating Budget Targets 3. Solvency Monitoring 4. Cash Flow Management
Capital Allocation and Growth
1. Microloan Funding 2. Equipment Financing 3. SBA Programs 4. Debt Consolidation
Mastering the Small Business Financial Puzzles for Maximum Profitability
Small business finance categories helps owners navigate complex capital needs while maintaining the healthy profit margins required to fuel long-term operational resilience.
Effective management of these financial areas provides a strategic compass for leaders, ensuring that every dollar supports sustainable growth in today’s unpredictable economy.
How should I structure my chart of accounts for maximum profit analysis?
| Finance Category | What It Measures | Impact on Profitability |
|---|---|---|
| Profitability ratios | Sustainable returns generation | Demonstrates discipline in converting revenue into profit |
| Operating expenses | Essential business costs | Keeps overhead low to ensure higher net gains |
| Liquidity metrics | Available working cash | Prevents costly debt cycles by maintaining operational buffers |
| Solvency ratios | Long-term debt health | Ensures financial stability by tracking total liability levels |
| Activity ratios | Resource efficiency levels | Optimizes asset utilization to improve return on investment |
Strategic Financial Pillars
Building a profitable enterprise requires balancing multiple financial dimensions, as no single metric provides a complete picture of your business’s health. Leaders often monitor these areas in combination to ensure their business remains agile, solvent, and ready for growth.
- Profitability benchmarks — Key profitability metrics determine how effectively your sales cover operational costs, acting as a report card for your pricing and efficiency.
- Operating budget targets — Small business budgets define specific percentage allocations for taxes, compensation, and overhead, preventing wasteful spending that erodes profit.
- Solvency monitoring — Financial solvency ratios measure total debt against assets, helping owners prove to lenders that their venture is built on a solid foundation.
- Cash flow management — Adequate cash flow remains a primary challenge for small firms, making it essential to align financing products with your specific revenue cycles.
Capital Allocation and Growth
Securing the right funding is a strategic move, but the type of capital chosen directly influences your ongoing profitability and repayment flexibility. By matching the right tool to your business’s specific lifecycle stage, you can optimize for growth without over-leveraging your operations.
- Microloan funding — Small dollar loans are often ideal for startups and underrepresented owners who need manageable debt for early-stage operations.
- Equipment financing — Better equipment systems can directly improve operating efficiency, leading to higher margins over the long term through reduced downtime.
- SBA programs — Government backed loans offer structured support for diverse needs, helping businesses strengthen their financial standing with more predictable terms.
- Debt consolidation — Expensive debt consolidation allows owners to reduce interest burdens, which directly improves bottom-line performance by freeing up monthly cash flow.
Consistent analysis of these financial categories allows owners to transform raw data into a narrative of success that attracts both investors and lenders.

The Pathways Toward Financial Progress, Ratings and Results Strategies
Efficient growth firms consistently outperform by simultaneously balancing revenue expansion, margin improvement, and capital efficiency. Strategic success relies on tracking precise performance metrics and integrating digital tools to drive operational excellence across every level of the organization.
How can I track key financial performance indicators for small business growth?
| Performance Metric | Primary Focus | Key Strategic Benefit |
|---|---|---|
| Revenue Growth Rate | Tracking top-line revenue increases | Demonstrates product-market fit and sustained demand |
| Gross Margin | Measuring percentage of remaining revenue after costs | Identifies true profitability per service or product line |
| Return on Assets | Evaluating value generated from all deployed company resources | Ensures capital is utilized efficiently rather than wasted |
| Customer Acquisition | Balancing costs with long-term customer value | Optimizes marketing spend for sustainable scaling efforts |
Strategic Growth Pathways
Leaders who achieve outperformance typically manage a diverse portfolio of initiatives while maintaining clear accountability for results. By systematically testing new growth engines and pivoting away from underperforming projects, businesses can maintain the agility required to thrive in volatile economic environments.
- Innovation culture and mindset allow companies to accelerate growth, often yielding significantly higher shareholder returns compared to organizations focused solely on traditional financial metrics.
- Active portfolio management ensures that talent and capital are consistently allocated to the most promising initiatives, preventing reliance on a single, vulnerable bet.
- Long-term strategic vision provides the necessary stability to weather market shifts, even when immediate quarterly profits dip due to heavy research and development investments.
Driving Financial Performance
Effective financial health requires more than just monitoring profit and loss; it demands a deep integration of data and operational discipline. Scaling businesses that succeed in the long run use automated systems and rigorous benchmarking to translate their high-level strategy into tangible profitability.
- Strategic alignment processes link core business functions, capital allocation, and internal systems to ensure that daily operations directly support overarching profit goals.
- Horizontal and vertical benchmarking against past performance and industry peers uncovers operational gaps, providing the visibility needed to adjust pricing power or cost structures.
- Digital tool integration including AI and advanced analytics transforms raw data into actionable insights, accelerating decision-making speed across the entire organization.
Maintaining consistent growth and profitability while simultaneously improving sustainability scores creates a powerful competitive advantage that drives superior shareholder value.
Profit Optimization and Analysis
Profitability analysis serves as a multi-dimensional framework for understanding how revenue quality and cost structures drive sustainable earnings, while profit optimization focuses on identifying and capturing specific opportunities to improve those financial results.
By moving beyond traditional profit and loss statements, these practices allow organizations to pinpoint which segments—such as products, customers, or channels—truly contribute to value creation.
Profit optimization involves systematically improving a company’s profitability by analyzing various factors that influence revenue and costs. This process includes strategies like pricing adjustments, customer and product mix analysis, and managing discounts and promotions.
How do I identify which products are driving the most profit margin?
| Analysis Method | Focus Area | Key Benefit |
|---|---|---|
| Gross margin analysis | Revenue minus direct costs | Measures core product efficiency |
| Activity-based costing | Shared resource allocation | Assigns indirect costs accurately |
| Scenario planning | Future market conditions | Projects profitability shifts ahead |
| Variance analysis | Price-Volume-Mix changes | Explains underlying margin swings |
Strategic Profit Analysis
Profit analysis techniques provide the foundational data required to assess business health by comparing actual performance against break-even points and long-term targets. These methods shift the focus from aggregate figures toward granular insights that prevent underperforming areas from consuming resources without delivering adequate returns.
- Gross profit margin reveals the percentage of revenue retained after direct costs, signaling how well a business manages its primary production or service delivery.
- Asset efficiency ratios measure how effectively an organization utilizes its inventory, fixed assets, and working capital to generate sales and bottom-line profit.
- Customer lifetime value projects long-term profitability beyond initial transactions, which informs critical marketing spend and long-term retention strategies.
Effective analysis acts as the diagnostic tool that informs every major strategic pivot, from deciding whether to outsource manufacturing to adjusting the overall product mix.
Driving Profit Optimization
Margin optimization initiatives identify specific levers that capture higher returns by refining product management, channel strategies, and discount governance. Organizations leverage these insights to redirect commercial activity toward the most profitable segments while exiting or restructuring those that drain value.
- Pricing optimization strategies involve conducting market research and competitor benchmarking to ensure price points maximize demand without sacrificing healthy margins.
- Cost reduction measures focus on streamlining operations and negotiating supplier deals to remove unnecessary expenses that are not immediately visible on standard reports.
- Unit economics modeling quantifies the total cost to serve each individual customer or channel, ensuring that pricing decisions are grounded in actual resource consumption.
Sustainable growth is achieved when leaders balance aggressive revenue expansion with disciplined margin protection through constant, data-driven adjustment of these core variables.
Key Aspects of Profit Optimization
- Definition — Profit optimization is the systematic process of improving profitability by analyzing revenue and cost factors.
- Techniques — It includes strategies such as pricing strategy, customer mix, and promotional investments.
- Benefits — Effective profit optimization identifies inefficiencies, improves margins, and supports sustainable growth.
- Analytical Frameworks — Advanced techniques utilize mathematical economic theories to optimize profit strategies.
- Implementation — A structured approach often involves a four-step process to define and implement initiatives.
Accounts for Maximum Profit and Analysis
Customer profitability analysis is a strategic framework used to evaluate the actual profit contribution of specific accounts by comparing their revenue against the full cost of acquisition, support, and ongoing maintenance.
This approach enables businesses to look past top-line revenue figures, which often obscure the reality that some high-volume clients may actually be net-loss accounts due to hidden service requirements.
.How do I calculate profit maximization using accounting data?
| Analytical Focus | Key Objective | Core Calculation |
|---|---|---|
| Account level profitability | Determine if an account warrants investment or remediation | Revenue minus COGS and variable delivery costs |
| Customer value drivers | Identify which relationships reshape commercial priorities | Net revenue minus direct and serving costs |
| Break-even point | Calculate the volume required to cover fixed costs | Total fixed costs divided by unit margin |
| Operating profit margin | Measure efficiency across business operations | Operating profit divided by total sales |
Core Methodology
Effective profitability analysis requires a transition from aggregate reporting to granular, account-specific metrics. This process involves isolating individual customer data to ensure resource allocation is based on actual returns rather than general volume assumptions.
- Invoice extraction — customer profitability analysis begins by gathering billing data to identify every cost, discount, and rebate associated with a specific client relationship.
- Service scope verification — account profitability auditor tools allow managers to compare actual labor inputs against dollar-per-square-foot benchmarks to ensure pricing aligns with the facility type.
- Direct cost measurement — cost-to-serve analysis accounts for all variable delivery and support costs, moving beyond traditional gross margin to reveal bottom-line contributions.
Strategic Applications
Applying these insights helps leadership teams move away from volume-based growth and toward margin-focused sustainability. By understanding the true cost of serving specific customers, organizations can make data-driven decisions regarding pricing, renewals, and resource focus.
- Deal negotiation guardrails — fact-based sales negotiations equip account teams with clear boundaries during renewals, ensuring that expansion paths improve margin rather than just ARR.
- Smarter resource allocation — customer success teams use these metrics to avoid overinvesting in accounts that deliver minimal returns, shifting attention to more viable segments.
- Pricing model adjustments — target profit margins can be engineered through contribution margin analysis, which helps managers understand how fluctuations in material costs affect the final bottom line.
Managerial accounting techniques provide the necessary foundation for these models by helping operators project profit at various sales levels through contribution margin projections.
Key Aspects of Maximum Profit Analysis
Understanding maximum profit analysis is crucial for effective business strategy.
- Marginal Cost and Revenue — Maximum profit occurs when marginal cost (MC) equals marginal revenue (MR), indicating the most efficient production level.
- Profit Maximization Rule — Firms should increase production until the cost of producing one more unit equals the revenue generated from that unit.
- Cost-Volume-Profit Analysis — This method assesses how changes in costs and volume affect profits, helping businesses make informed decisions.
- Profitability Ratios — These ratios evaluate a company’s ability to generate profit relative to its revenue and costs, providing insights into financial health.
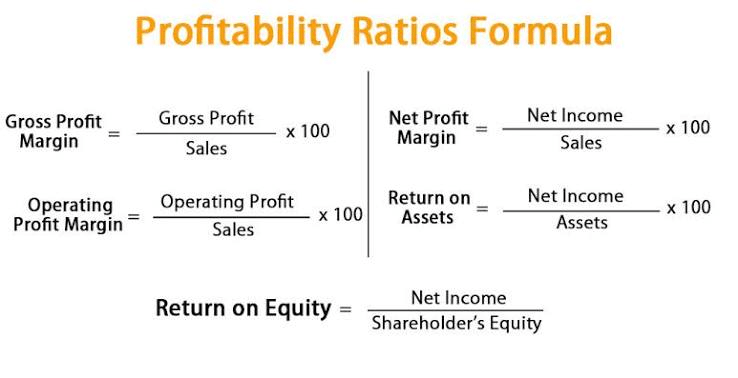
Profitability Ratios and Analysis
Profitability ratios are financial metrics used to assess a company’s ability to generate profit relative to its revenue, assets, or equity. Common types include gross profit margin, operating profit margin, net profit margin, return on assets (ROA), and return on equity (ROE). These ratios help investors and management evaluate financial health and operational efficiency.
Profitability ratios serve as a fundamental cornerstone of financial analysis, allowing investors and business managers to evaluate a company’s ability to generate earnings relative to its revenue, operating costs, assets, and equity. These metrics are generally categorized into margin ratios, which focus on revenue retention, and return ratios, which measure the efficient use of invested capital.
How do I calculate net profit margin for a small business?
| Ratio Name | Financial Category | Primary Use Case |
|---|---|---|
| Gross profit margin | Margin Ratio | Evaluating core operational efficiency |
| Operating profit margin | Margin Ratio | Measuring earnings after operating expenses |
| Net profit margin | Margin Ratio | Determining final shareholder earnings |
| Return on assets | Return Ratio | Assessing income generated from assets |
| Return on equity | Return Ratio | Calculating returns on book value |
Margin and Performance Metrics
Margin ratios provide a direct look at how much of each dollar of revenue a company retains after covering specific categories of costs. By standardizing these figures as percentages, analysts can easily compare performance across different industry peers and business models.
- Pretax margin — Pretax profit measures how a business performs before accounting for jurisdictional tax variations and non-core financial items.
- Cash flow margin — Operating cash flow indicates the actual liquidity generated from sales, ensuring that accounting profits align with real-world cash availability.
- EBITDA margin — Core operating profit is assessed here by excluding non-cash expenses like depreciation and amortization, which can often skew performance data.
- Markup ratio — Product pricing efficiency is analyzed to see how much the selling price exceeds the direct cost of goods produced.
- Expense-to-revenue ratio — General cost structure reviews allow managers to keep overheads in check relative to incoming sales volume.
Return and Efficiency Analysis
Return ratios shift the focus to how effectively management leverages internal resources to produce value for shareholders. These indicators are vital for long-term strategic planning and benchmarking against historical company performance or specific budgeted targets.
- Return on capital — Capital employed efficiency shows the profit yield from all long-term investments and debt financing used by the firm.
- Return on investment — General investment performance provides a snapshot of gains relative to the total cost of an initial capital outlay.
- Return on invested — Invested capital returns specifically filter for the efficiency of money provided by both debt and equity holders.
- Receivables turnover — Credit management health is evaluated by how quickly a company collects payments from customers after credit sales.
- Earnings per share — Shareholder profit allocation defines the portion of net income assigned to each outstanding share of common stock.
Understanding these ratios ensures that stakeholders can form a comprehensive narrative of a company’s financial health, moving beyond simple revenue totals to see what truly remains for reinvestment or dividends.
Types of Profitability Ratios
Understanding various profitability ratios is essential for financial analysis.
Return on Equity (ROE) — This ratio measures the profitability relative to shareholders’ equity, showing how well a company generates returns for its investors.
Gross Profit Margin — This ratio measures the percentage of revenue that exceeds the cost of goods sold, indicating how efficiently a company uses its resources.
Operating Profit Margin — It reflects the percentage of revenue left after covering operating expenses, providing insight into operational efficiency.
Net Profit Margin — This ratio shows the percentage of revenue that remains as profit after all expenses, taxes, and costs are deducted.
Return on Assets (ROA) — ROA indicates how effectively a company uses its assets to generate profit, calculated as net income divided by total assets.
Operating Expense and Analysis
Operating expenses, often referred to as OpEx, represent the essential costs a business incurs through its normal, day-to-day operational activities. These expenditures are distinct from the costs of producing goods or delivering services and are necessary to keep a company running and generating revenue.
How do I calculate the operating expense ratio for my business?
| Expense Type | Nature of Cost | Examples |
|---|---|---|
| Fixed operating expenses | Remain consistent regardless of production levels | Rent, salaries, and insurance premiums |
| Variable operating expenses | Fluctuate in proportion to business volume | Shipping costs, packaging(Sponsored), and sales commissions |
Core Components and Analysis
Day-to-day costs that keep a business functional are categorized as operating expenses, excluding items directly tied to production like. These expenses are fundamental for evaluating management efficiency and understanding the primary drivers of a company’s financial performance.
- Administrative fees and management salaries are categorized as overhead costs because they support the business infrastructure.
- Advertising and marketing expenditures are common operating expenses used to promote goods or services to the target market.
- Utility costs such as heating, and telecommunications are recurring charges required to maintain operational facilities.
- Research and development investments are often classified as OpEx, allowing companies to innovate while continuing their core business operations.
Operating income is derived by subtracting these total operating expenses from a company’s gross profit, providing a clear snapshot of profitability from core business functions.
Distinctions from Other Financial Costs
Non-operating expenses arise from activities outside a company’s primary commercial operations, such as financing or investing, and are therefore excluded from the operating expense calculation. Separating these costs allows analysts and managers to better isolate the profitability of a company’s everyday business model from the impacts of debt or asset disposals.
- Interest charges on business loans are the most common example of non-operating financial costs.
- Losses from investments or currency exchange fluctuations are typically treated as peripheral expenses rather than core operational costs.
- Income tax obligations are classified as non-operating items and should not be included when calculating the total OpEx for a business.
- Capital expenditures involve acquiring or upgrading physical assets and are treated differently for accounting and tax purposes than ordinary operating expenses.
Diligent accounting of these operational costs is critical for businesses to maintain growth and avoid spending oversights that could impact their bottom line.
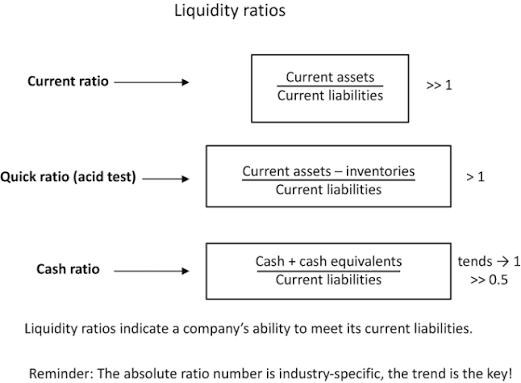
Liquidity Metrics and Analysis
Financial liquidity metrics provide a snapshot of a company’s ability to pay off current debt obligations without needing to raise external capital. These indicators serve as vital tools for analysts and investors to assess the short-term financial health and operational stability of a business.
Liquidity metrics are financial indicators that assess a company’s ability to meet its short-term obligations. They are crucial for evaluating financial health and ensuring sufficient liquid assets are available to cover immediate expenses.
How do I calculate the current ratio for a company?
| Metric Name | What It Measures | Target Indicator |
|---|---|---|
| Current ratio | Ability to cover short-term liabilities with current assets | Ratios above 1.0 are usually considered healthy |
| Quick ratio | Capacity to pay debts using only the most liquid assets | Values above 1.0 signal strong debt-handling ability |
| Cash ratio | Conservative assessment using only cash and cash equivalents |
Understanding Liquidity Metrics
Liquidity metrics provide insights into a company’s financial stability.
- Current Ratio — This ratio compares current assets to current liabilities, indicating short-term financial health. A ratio above 1 suggests good liquidity.
- Quick Ratio — Also known as the acid-test ratio, it measures the ability to meet short-term obligations without relying on inventory sales. A ratio above 1 is generally favorable.
- Cash Ratio — This is the most conservative liquidity metric, focusing solely on cash and cash equivalents against current liabilities. A higher cash ratio indicates stronger liquidity.
- Days Sales Outstanding (DSO) — This metric assesses how quickly a company collects cash from credit sales, with lower values indicating efficient collection processes.
- Market Liquidity Indicators — These include bid-ask spreads and trading volumes, which reflect the ease of buying or selling assets in the market.
Core Liquidity Concepts
Accounting liquidity describes the ease with which a company can settle its immediate financial obligations using available liquid assets. While these ratios focus on the short term, they offer distinct levels of stringency:
- Current assets represent the broadest view of liquidity, including everything from cash to inventory that can be turned into funds within a year.
- Cash equivalents and marketable securities are prioritized in the most conservative calculations to determine how much of a company’s debt can be settled right now.
- Negative working capital often results when a ratio falls below 1.0, signaling that a firm may be facing a potential liquidity crisis.
Strategic Analysis Applications
Financial analysts leverage these measurements to identify trends and assess potential risks before recommending investments or credit extensions. Integrating these snapshots with broader data ensures a more comprehensive view of financial stability:
- Cash flow forecasting is often paired with standard ratios to mitigate the limitation that balance sheet data only captures a single point in time.
- Solvency ratios are distinct from liquidity metrics, as they examine long-term leverage and a company’s ability to sustain operations over several years.
- Profitability metrics measure the efficiency of generating earnings, confirming that being profitable on paper does not automatically guarantee the ability to pay immediate bills.
Liquidity ratios remain fundamental tools for ensuring that your business maintains the financial flexibility required for long-term growth and resilience.
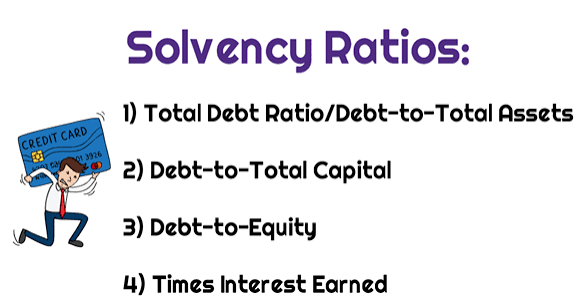
Solvency Ratios and Analysis
Solvency ratios serve as key financial metrics used by lenders and investors to evaluate a company’s capacity to meet its long-term financial obligations. These measures look beyond immediate cash needs, focusing instead on whether a firm’s capital structure and cash flow are sustainable enough to support ongoing operations and debt repayment over time.
.How do I interpret a debt-to-equity ratio above two?
| Ratio | Formula | What It Measures |
|---|---|---|
| Debt to Equity | Total Debt ÷ Total Equity | The proportion of financing contributed by creditors compared to shareholders |
| Debt to Assets | Total Debt ÷ Total Assets | The degree to which a company’s total assets are financed by debt |
| Equity Ratio | Total Equity ÷ Total Assets | The value of a company’s shareholders’ funds relative to its total assets |
Understanding Long-Term Viability
Long-term financial health is the primary focus of these metrics, which analysts use to assess if an organization will remain solvent as it navigates future growth and debt obligations. By comparing historical data with present figures, investors can identify trends in how a business manages its liabilities and whether its reliance on debt financing is increasing or decreasing.
- Interest coverage ratio examines a firm’s profitability against its obligations by dividing earnings before interest and taxes by total interest expenses
- Standardized solvency ratios allow analysts to compare different companies, though industry-specific benchmarks are necessary because capital structure norms vary widely across sectors
- Financial health indicators help predict the probability of default, as lower ratios generally signal a greater risk that a company will struggle to meet its long-term commitments
Practical Application and Interpretation
Corporate finance professionals utilize these ratios in diverse contexts, including insurance regulation and pension fund management, to ensure that organizations maintain sufficient capital buffers. Because solvency is inherently a long-term concept, a company may remain operational for a period even while technically insolvent, provided it maintains enough liquidity to fund daily requirements.
- Creditworthiness evaluations rely on these tools to determine if a prospective borrower is a sound investment for debt capital
- Market perception effects often follow strong solvency figures, as a high ratio can boost investor confidence and potentially lead to a higher share price
- Regulatory supervisory monitoring uses these metrics as a formal mechanism to track the financial soundness of institutions in protected or sensitive sectors
Effective financial analysis treats these ratios as a measure of structural stability, providing a clear picture of how well a company’s core operations support its long-term debt burden.
Your Solvency Ratio Definition, Types & Calculation Here.AI SummarySolvency ratiosSolvency ratios are financial metrics used to assess a company’s ability to meet its long-term obligations, indicating its financial health. These ratios compare a company’s total assets to its total liabilities, helping stakeholders evaluate risk and stability.
Understanding Solvency Ratios: Solvency ratios provide insights into a company’s financial stability.
- Definition — Solvency ratios measure the extent to which a company’s assets can cover its liabilities, indicating financial health.
- Types — Common solvency ratios include the debt to equity ratio and the interest coverage ratio, each serving different analytical purposes.
- Importance — Investors and creditors use solvency ratios to assess risk before making financial decisions.
- Calculation — A basic solvency ratio can be calculated as $ \text{Solvency Ratio} = \frac{\text{Total Assets}}{\text{Total Liabilities}} $.
Activity Ratios and Analysis
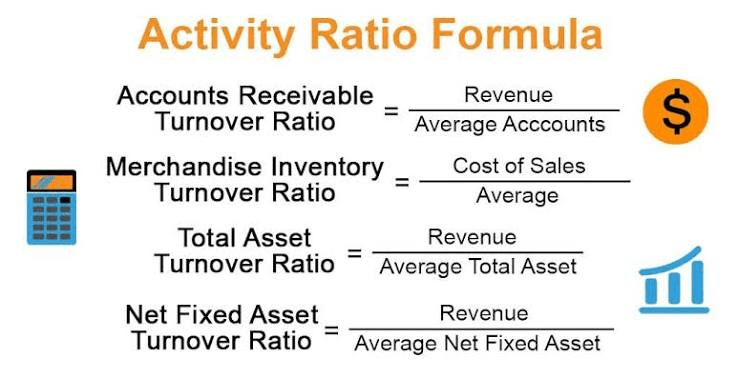
Financial activity ratios act as vital efficiency metrics that help investors and analysts understand how effectively a company leverages its balance sheet assets to generate revenue. These tools bridge the gap between a firm’s operational management and its financial performance, showing how quickly capital is converted into cash or sales
Activity ratios measure how efficiently a company utilizes its assets to generate revenue. They provide insights into operational efficiency by evaluating aspects like inventory management and receivables collection.
.How do I calculate inventory turnover to measure operational efficiency?
| Ratio Type | Primary Focus | Operational Insight |
|---|---|---|
| Total assets turnover | Revenue generation | Indicates efficiency in utilizing all company assets to produce sales |
| Inventory turnover ratio | Stock management | Measures how quickly a business sells and replaces its inventory |
| Accounts receivable turnover | Collection speed | Evaluates the effectiveness of credit policies and collection procedures |
Operational Efficiency
These metrics provide a clear lens into the day-to-day productivity of a business by monitoring how assets are managed across different reporting periods. Analysts use them to benchmark performance against industry competitors, which can highlight areas where management might need to refine its resource allocation or operational processes.
- Improved activity ratios often correspond with higher profit margins, signaling that a company is extracting more value from every dollar of assets.
- Long-term trend lines are recommended for investors, as they help identify consistent, gradual improvements in how a firm’s management team handles its core resources.
- Operating asset utilization provides a bridge between balance sheet components and income statement results, revealing the operational story behind a company’s financial health.
Ratios vs. Profitability
While both sets of indicators are essential for a complete financial picture, they serve distinct purposes in a comprehensive analysis. Activity ratios focus specifically on the granular, operational side of the business, whereas other tools evaluate different aspects of financial success.
- Profitability ratios differ by measuring the overall ability of a business to generate earnings relative to its revenue, assets, or equity after costs are accounted for.
- Operational efficiency is the primary target of activity ratios, which quantify how well a company uses its specific resources to drive sales rather than just measuring final profit margins.
- Comprehensive financial analysis relies on combining these metrics, as a business could theoretically display excellent efficiency ratios while struggling with poor profitability due to external pricing pressures.
Mastering these indicators allows you to better assess the management effectiveness of any business you are evaluating.
Understanding Activity Ratios
Activity ratios are crucial for assessing business performance.
- Definition — Activity ratios, also known as efficiency ratios, indicate how well a company leverages its assets to produce revenue.
- Types — Common types include inventory turnover, receivables turnover, and asset turnover, each measuring different operational aspects.
- Importance — These ratios help identify operational strengths and weaknesses, guiding management decisions.
- Calculation — For example, inventory turnover is calculated as $ \text{Cost of Goods Sold} / \text{Average Inventory} $.
- Limitations — While useful, activity ratios can be influenced by external factors like market conditions, which may skew results.

Strategic Financial Pillars for Profitability
Profitability Analysis Benchmarks
Profitability benchmarks are critical metrics that allow businesses to evaluate their financial performance against industry standards. These benchmarks help companies identify areas for improvement and assess their competitive position within their sector.
Industry profitability benchmarks serve as a critical baseline for measuring financial performance, helping business owners evaluate their standing, identify potential gaps, and make data-driven decisions.
Knowing your numbers is the report card for your business model, distinguishing between activities that simply keep you busy and those that effectively convert revenue into sustainable profit.
How to calculate net profit margin for a small business?
| Sector | Metric | Key Contextual Insight |
|---|---|---|
| Construction | 8–12% Net Margin | Mid-size and large firms report higher net profitability than small residential contractors. |
| Software | 20–25% Net Margin | Heavy R&D investments and sales costs typically temper high gross margins. |
| Direct-to-Consumer | 5–10% Operating Margin | Healthy DTC brands target this range, though many smaller operations struggle at breakeven. |
| Insurance Agency | 25+ KPIs | Operational efficiency metrics are vital for comparing profitability, growth, and producer productivity. |
Navigating Profit Margin Types
Understanding the nuances between margin types is essential because gross, operating, and net margins answer different questions about your financial health. Relying on a single number without understanding how it was calculated can lead to dangerously distorted comparisons.
- Gross profit margin measures the efficiency of production by subtracting the cost of goods sold from total revenue, serving as the foundation for profitability across all business verticals.
- Operating profit margin acts as a more honest indicator of efficiency, accounting for rent, payroll, marketing, and other fixed expenses required to run the business daily.
- Net profit margin represents the comprehensive bottom line, revealing how much of every dollar earned is retained after all expenses, interest, and taxes are paid.
Understanding Profitability Benchmarks
Profitability benchmarks provide valuable insights into business performance.
- Industry Standards — Profitability benchmarks vary by sector, with consulting firms typically aiming for utilization rates of 60-70%.
- Comparative Analysis — Companies can use these benchmarks to compare their profit margins against competitors, helping to identify strengths and weaknesses.
- Performance Metrics — Key metrics include operating margins, net profit margins, and return on equity, which are essential for assessing overall financial health.
- Resource Efficiency — High-performing firms often achieve better profitability through efficient resource management and strategic pricing.
Strategic Use of Benchmarks
Applying benchmark data correctly involves looking outward rather than relying solely on internal year-over-year growth, which is often insufficient in volatile economic landscapes. Consistent review of these figures allows you to adjust your strategy before financial weaknesses turn into formal rejection reasons during financing applications.
- Profit leakage identification is a primary benefit of benchmarking, as it helps reveal if your rent-to-revenue ratio is significantly higher than industry peers.
- Data-backed objectives can replace arbitrary growth targets, allowing you to align your goals with 5-year industry forecasts and broader economic trends.
- Quarterly review cycles are recommended, as competitive dynamics and pricing pressures shift rapidly, making older 2024 data potentially unreliable for current decision-making.
Strategic benchmarking should ultimately help you ask better questions about your own financial statements, providing context that empowers smarter growth rather than grading you against a standard built for someone else.
Operating Budgets and Analysis Targets
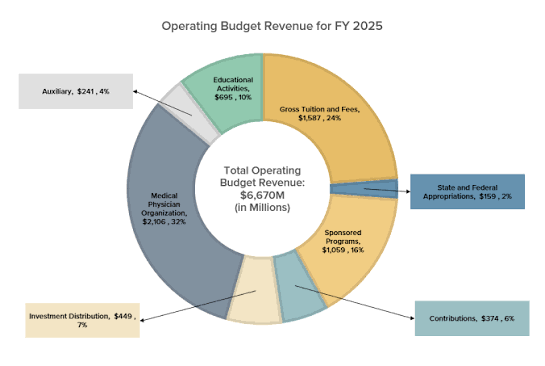
Operating budget targets are specific financial goals set for revenues and expenses within a defined period, typically a fiscal year. These targets help organizations manage their resources effectively and ensure alignment with strategic objectives.
Key Aspects of Operating Budget Targets
Setting operating budget targets provides a structured roadmap that aligns your daily expenses with long-term financial goals and profitability metrics. By establishing clear objectives early, you ensure that every dollar spent directly supports your organization’s growth and operational efficiency.
Understanding the components of operating budget targets is essential for effective financial management.
- Definition — Operating budget targets outline expected revenues and expenses related to daily operations, such as sales and utilities.
- Purpose — They serve to guide financial planning and resource allocation, ensuring that spending aligns with organizational goals.
- Components — Typical components include fixed costs (like rent) and variable costs (like materials), which are crucial for accurate forecasting.
- Monitoring — Regular tracking against these targets allows for timely adjustments and improved financial performance.
- Variances — Analyzing variances between actual and budgeted figures helps identify areas for improvement and informs future budgeting processes.
How do I calculate realistic operating budget growth percentages?
| Target Metric | Purpose | Strategic Focus |
|---|---|---|
| Gross margin targets | Define base profitability | Establishing baseline before expenses |
| Operating margin goals | Measure scalable health | Ensuring business stays profitable |
| G&A overhead caps | Control leadership costs | Limiting administrative spending growth |
| Budget variance limits | Track performance gaps | Triggering reviews for high deviations |
Establishing Core Objectives
Developing an effective budget requires a strategic framework that moves beyond simple expense tracking to active decision-making. By setting margin targets before touching a spreadsheet, you can determine whether your business model is fundamentally profitable.
- Historical financial data offers the most reliable baseline for your projections by revealing past spending patterns and seasonal growth trends.
- Sales budget volume projections allow you to account for seasonal income shifts and adjust your monthly resource allocation accordingly.
- Fixed and variable cost separation helps you diagnose budget shortfalls accurately and ensures that expenses remain balanced against revenue shifts.
Monitoring and Adjusting
A budget serves as a practical tool for operational clarity only when it is regularly revisited and refined based on new market information. Consistently reviewing your performance against these targets helps identify inefficiencies before they compound into larger financial challenges.
- Budget variance percentage analysis acts as an early warning system, where gaps exceeding 5% for mature categories trigger a formal review.
- Monthly target conversion turns your annual roadmap into actionable short-term goals that reflect hiring schedules and known annual payments.
- Conservative revenue estimates provide a safer foundation for planning, allowing you to reallocate funds mid-year from a position of financial strength.
By regularly tracking these metrics, your leadership team gains the agility needed to pivot resources toward high-impact initiatives like market expansion or product success.
Solvency Monitoring and Analysis
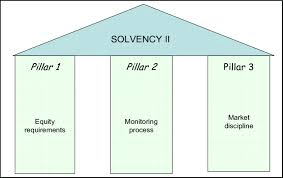
Solvency monitoring represents the ongoing evaluation of a company’s long-term financial health by assessing its ability to meet debt obligations and continue operations into the future.
By analyzing balance sheet stability and cash flow capabilities, businesses and their stakeholders ensure they maintain the positive net worth necessary to survive long-term economic shifts.
Solvency monitoring is a critical process used to assess an organization’s financial health and ability to meet long-term obligations. It involves analyzing various financial metrics and ratios to ensure that a company remains solvent and can withstand economic fluctuations.
How do regulators measure insurance company solvency ratios effectively?
| Monitoring Metric | Focus Area | Analytical Utility |
|---|---|---|
| Total assets equity | Financial structure | Measures how much of a firm’s base is financed by shareholders versus external debt |
| Debt to assets | Leverage risk | Evaluates potential default by comparing total liabilities to the resources available to cover them |
| Interest coverage | Operational cash | Tracks cash flow capacity to pay recurring interest costs on long-term loans |
Key Aspects of Solvency Monitoring
Understanding the components of solvency monitoring is essential for effective financial management.
- Importance — Solvency monitoring helps identify financial distress early, allowing for timely interventions.
- Key Ratios — Common solvency ratios include the debt-to-equity ratio and the current ratio, which provide insights into a company’s financial stability.
- Regulatory Framework — Organizations like the NAIC provide guidelines and tools for effective solvency monitoring.
- Automation — Automated systems can streamline the monitoring process, reducing human error and increasing efficiency.
Core Objectives of Monitoring
Monitoring solvency allows leadership to maintain a clear picture of whether a business owns more than it owes. This practice is essential for securing favorable credit, as lenders look for evidence that a firm can manage its liabilities without becoming overextended.
- Financial stability oversight helps management navigate risks like unpaid invoices while protecting the firm against forced asset sales.
- Long-term growth capacity is strengthened when companies use monitoring to signal their creditworthiness to potential investors and partners.
- Managing operational risks ensures that firms do not compromise shareholder equity while navigating their debt obligations.
Distinguishing Solvency from Liquidity
While monitoring solvency focuses on long-term sustainability, it is often paired with liquidity tracking to provide a complete view of a company’s fiscal condition. Because a firm can be solvent yet temporarily illiquid, these metrics together create a robust framework for financial decision-making.
- Liquidity ratios assess the ability to pay short-term bills by looking at cash, accounts receivable, and marketable securities.
- Complementary indicators provide a clearer picture of both near-term resilience and long-term viability for analysts and regulators.
- Monitoring both regularly prevents preventable financial crises and ensures the company stays competitive in its specific industry.
Maintaining a rigorous monitoring process enables firms to adjust their financing structure and debt levels before they face the risk of insolvency.

Cash Flow Management and Analysis
Effective cash flow management serves as a critical strategic function for small businesses, determining their ability to pay staff, pursue growth, and navigate periods of economic uncertainty.
While cash flow tracks the specific timing of when money hits or leaves your bank account, it remains distinct from profit, which does not account for variable costs or consumer demand.
How can small businesses optimize their cash conversion cycle effectively?
| Management Strategy | Focus Area | Impact on Liquidity |
|---|---|---|
| Send invoices immediately | Accounts Receivable | Reduces the time capital is tied up in outstanding payments |
| Negotiate payment terms | Accounts Payable | Provides extra time to collect customer payments before paying suppliers |
| Consolidate business debt | Debt Management | Simplifies repayment into a single monthly bill at potentially lower rates |
| Forecast future demand | Inventory Control | Helps avoid over-investing in stock while maintaining sufficient levels |
Core Monitoring and Tools
Staying in control of your financial health requires a continuous process of tracking, analyzing, and optimizing the movement of money. Because cash shortfalls often stem from poor planning rather than a lack of profitability, maintaining visibility into your operational expenses is vital for long-term survival.
- Cash flow forecasting allows owners to anticipate potential shortfalls in advance, providing the necessary window to implement corrective solutions.
- Real-time monitoring tools categorize expenses and link multiple bank accounts, helping business owners stop switching between tabs to see the big picture.
- Dedicated banking advisors offer personalized recommendations on treasury tools and credit options tailored to the specific size and industry of your company.
This proactive approach to your finances helps build the credibility required to secure funding or gain the trust of potential investors and lenders.
Addressing Seasonal Challenges
Seasonal small businesses face unique pressures where cash flow fluctuates significantly across different phases, including busy, slow, and shoulder periods. Developing a resilient strategy involves preparing for these cycles so that you can maintain operations without overextending your budget.
- Weekly cash budgets can be implemented anytime and maintained across all four seasonal phases to ensure consistent oversight.
- Strategic cash reserves built during peak busy seasons provide a cushion for capital needs when demand slows down.
- Inventory management systems help ecommerce and retail businesses weather fluctuations by matching stock levels to anticipated consumer demand.
Successful navigation of these cycles ensures your business remains stable and prepared for growth, regardless of the time of year.
Capital Allocation and Growth
Microloan Funding and Analysis
The global micro lending market is undergoing a significant transformation, with its valuation expected to climb toward nearly half a trillion dollars by the next decade. This growth is driven by technological integration and increasing financial inclusion mandates, shifting the landscape toward digital-first, low-cost delivery models.
How have global microloan interest rates changed?
| Market Segment | 2026 Estimate | 2034/2035 Forecast | Key Growth Driver |
|---|---|---|---|
| Global Market Size | $270.99 billion | $751.2 billion | Fintech adoption in underserved areas |
| Regional Leader | Asia-Pacific | N/A | Digital identity systems reducing onboarding costs |
| Loan Disbursement | N/A | N/A | Women-led businesses with strong repayment records |
| Delivery Channel | N/A | N/A | Mobile-centric lenders using AI scoring |
Emerging Trends and Drivers
Digital transformation remains the primary catalyst for market expansion, as lenders move away from traditional branch-based models toward highly scalable mobile platforms. By leveraging artificial intelligence to process thousands of non-traditional data points, institutions can now assess risk for “thin-file” borrowers who were previously excluded from formal financial systems.
- Fintech-led customer acquisition reduces operational costs by up to 70% compared to legacy branch models, enabling profitable lending at ticket sizes as low as $40.
- Government-backed digital identity infrastructure, such as India’s Aadhaar system, has cut know-your-customer costs by as much as 80%, accelerating formal financial onboarding.
- Impact-linked micro-credit funds are gaining momentum in North American and European markets, where ESG strategies increasingly integrate micro-finance as a vehicle for sustainable development.
Strategic Market Outlook
Financial institutions are increasingly prioritizing borrower segments that demonstrate historical resilience and sustainable growth potential. While regulatory environments remain a constraint for larger loan products, the micro-enterprise sector continues to benefit from specialized, collateral-free credit facilities that support entrepreneurial activity in both emerging and developed economies.
- Women-led business lending has become a global priority for major financial institutions because these borrowers consistently show strong repayment records and alignment with inclusive growth goals.
- Mobile banking platforms currently account for nearly half of all active microloan origination volume and outstanding portfolios, signaling a permanent departure from offline servicing.
- Aspirational district initiatives show that targeted credit support can lead to significant improvements in asset quality, with delinquency rates dropping notably in underserved geographical pockets.
The continued rise of AI-driven credit assessment tools will likely further refine risk evaluation, allowing for more precise lending that balances market profitability with broader social inclusion objectives.
Equipment Financing and Analysis
Equipment financing provides a specialized funding solution that allows your business to acquire essential machinery, vehicles, and technology without the need to pay the full purchase price upfront. By using a loan or lease directly tied to the asset, you can preserve your company’s cash reserves while securing the tools necessary for operation and growth.
How do equipment loan interest rates compare to traditional business loans?
| Financing Option | Asset Status | Best Use Case | Typical Term |
|---|---|---|---|
| Equipment Loans | Owned by business | Standard machinery and long-term tools | 2 to 7 years |
| Equipment Leasing | Rented from lender | Fast-obsolete or high-tech equipment | 1 to 5 years |
| Business Line | Flexible access | Frequent smaller purchases or repairs | Revolving |
| SBA 504 Loan | Government backed | Heavy fixed assets and real estate | Up to 10 years |
Financing Structures and Ownership
The decision to utilize an equipment loan versus a lease often centers on your long-term ownership goals and current cash flow requirements. Loans generally build equity over time, leading to full ownership once the final payment is made, whereas leasing is often preferred when you need to frequently upgrade to the latest technology or want lower monthly payments to support near-term operations.
- Standard equipment loans provide a lump sum to purchase gear, with the asset itself serving as collateral to help secure approval and potentially lower interest rates.
- Sale-leaseback arrangements allow you to sell equipment you already own to a lender and lease it back, which can be a strategic way to unlock immediate working capital.
- Small Business Administration programs, including the 7(a) and 504 loans, offer government-backed options that can provide some of the lowest available interest rates for qualifying companies.
You should carefully assess your business goals, tax strategy, and the specific equipment type to determine whether an ownership-focused loan or a rental-focused lease fits your current trajectory best.
Qualifying and Application Steps
Qualifying for these financial products generally involves a review of both your business creditworthiness and the value of the equipment you intend to purchase. Lenders look at revenue strength, annual tax returns, and balance sheets to evaluate risk, though some specialized lenders may offer paths for startups or those with fair credit by focusing more heavily on the asset’s collateral value.
- Detailed business documentation like recent bank statements, tax returns, and a solid business plan is usually required to help the lender assess your ability to repay the debt.
- Specialized equipment lenders often provide a more personalized approach and faster funding timelines, sometimes issuing terms within hours for companies that meet their specific industry requirements.
- Commercial fleet financing is one of many niche paths available, allowing companies to secure vehicles or heavy machinery through dedicated programs that understand the unique demands of those sectors.
Once you have identified your needs and confirmed your eligibility, narrowing down a list of lenders that specialize in your specific industry will help ensure you obtain the most competitive terms and efficient funding process.
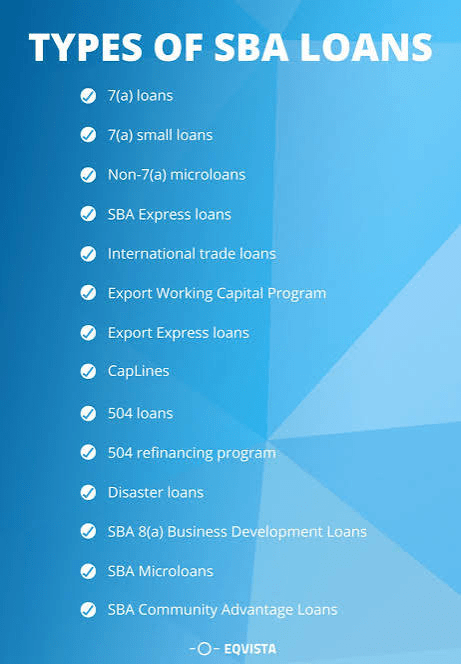
SBA Programs and Analysis
The Small Business Administration operates as an independent federal agency dedicated to helping entrepreneurs establish and grow their enterprises through capital, contracts, and counseling. By providing government-backed loan guarantees and managing specialized contracting programs, the agency helps strengthen the overall economy and supports business recovery following natural disasters.
Which SBA loan program is best for a startup business?
| Program Focus | Primary Objective | Eligibility Basis |
|---|---|---|
| Capital access | Enhancing funding through bank and credit union partnerships | Must meet specific small business size standards |
| Contracting programs | Expanding participation in prime and subcontracting opportunities | Ownership and control requirements for specific groups |
| Disaster recovery | Assisting businesses and homeowners after catastrophic events | Defined business or residential status in impacted areas |
Core Assistance Areas
The agency delivers aid across three main pillars, often referred to as the 3 Cs, which are designed to support the entire lifecycle of a small business. Whether helping a startup find initial funding or assisting established companies in securing federal work, these services ensure that small firms can compete effectively.
- Loan guaranty programs provide government-backed support to lenders, which allows banks and credit unions to extend credit to businesses that might otherwise struggle to obtain traditional financing.
- Contracting opportunities help businesses navigate the federal procurement landscape, with specific goals set annually for prime contracts awarded to qualified small enterprises.
- Counseling and training reach over 1 million entrepreneurs annually through a network of development centers, women-owned business centers, and mentor programs like SCORE.
Targeted Certification Programs
Specialized initiatives focus on stimulating economic growth within specific demographics or historically disadvantaged regions. These programs often require rigorous certification to ensure that contract dollars reach the intended target populations and underutilized business zones.
- HUBZone program encourages capital investment and employment in historically underutilized business zones, helping to stimulate economic development in these specific regions.
- 8(a) Business Development assists socially and economically disadvantaged owners by providing a structured pathway for business growth and federal procurement participation.
- Women-owned small business initiatives ensure that entities at least 51% owned and controlled by women receive equitable opportunities to compete for government work.
The agency maintains at least one office in every state to provide local support for these resources and services.

Debt Consolidation and Analysis
Debt consolidation serves as a financial strategy that simplifies your debt repayment process by combining multiple balances into a single, new loan or credit account. By streamlining your obligations, you can focus on making one monthly payment to a single institution rather than juggling various due dates and interest rates.
How does a debt consolidation loan affect my overall credit score?
| Consolidation Method | Key Benefit | Potential Risk |
|---|---|---|
| Personal loans | Fixed monthly payments provide a clear end date for debt payoff | Hard credit inquiries can cause a temporary dip in your score |
| Balance transfer cards | Zero interest incentives offer a window of time to pay down balances | Promotional interest rates eventually expire, potentially leading to higher costs |
| Home equity loans | Lower interest rates are often available compared to credit cards | Backing with assets like your home carries the risk of foreclosure |
How the Process Works
Managing multiple debts can be stressful, but consolidation aims to consolidate these into a more manageable structure. When you secure a new, often lower-interest loan, you use those funds to pay off your existing smaller debts in full.
- Improved financial organization is a primary advantage, as you move from managing various accounts to a single, consistent payment schedule.
- Longer repayment terms may be available, which can reduce your required monthly payment, though you should be aware that this often increases the total interest paid over the life of the loan.
- Interest rate reduction remains the main goal for most borrowers, as moving high-interest credit card debt into a lower-rate installment loan can result in significant long-term savings.
Ultimately, this process is best suited for those who have addressed the root causes of their debt, such as overspending, to avoid repeating the cycle once current balances are cleared.
Considerations Before Starting
Deciding to consolidate involves weighing your current credit health against your long-term goals, as not every situation benefits from this approach. Understanding the requirements for approval is just as important as knowing the potential impact on your credit report.
- Hard credit inquiries during the application process can lead to a minor, temporary decrease in your credit score.
- Good or excellent credit is typically required to qualify for the most favorable terms, including the lowest available interest rates.
- Debt management plans offer an alternative if you are struggling with unsecured debt and want professional negotiation assistance to reduce interest or waive certain fees.
Because consolidation does not erase the underlying debt, success depends on maintaining a disciplined repayment plan after the original accounts are paid off.

Give Professor Kissinger’s Success Puzzle, Analysis and Solutions 3 Months. You Won’t Recognize Your Business
The changes are fast, exciting, and undeniable in effectiveness.
Michel Kissinger’s Success Puzzle Solutions works with your company both at the micro and macro level. First, we work with your key leaders to strengthen your goals, values, and mission. Then we work with your managers, to create a cohesive plan to guarantee top results.
And then we work with your employees, to get them synergistically working toward company objectives, in a way that makes them feel great about themselves and appreciated by you for their contributions.
With the proper coaching, mentoring, resources, training, testing, and analysis, your whole team becomes a glorious machine where everyone works together.
What Your Small Business Success Can Look Like After Success Puzzle Coaching
- If you’re an airline, you could have on-time departures, every time.
- If you’re a restaurant chain, you could be reducing server turnover by 25%.
- If you’re a sales organization, you could be raising average order values and customer retention rates without needing to change a thing about your actual product.
- If you’re a first-responder team like a city fire department, you could have a considerable reduction in response times.
That is how powerful true team-alignment is. Lives can literally be saved. Unprofitable years can turn into record-setting wins.
And all this can happen with excellent leadership and empowered staff. When your team communicates and works together in harmony, much of your company needs just take care of themselves.
Your customers then automatically enjoy better service, from happier employees. Profit increases can become a sure thing.
40+ Years of Excellence and Successful Business Coaching Experience
There’s a reason why organisations of all sizes trust Michael Kissinger with this crucial team-alignment mission.
Michael Kissinger has spent many years helping numerous companies achieve their highest goals, faster than they ever thought would be possible.
Since he started over 40+ years age, he has personally coached thousands of people in person, and educated thousands on peak business performance.
Michael Kissinger started for the purpose of systematizing his methods, and bringing powerful, profitable solutions to companies across America.
What surprises many business owners, executives, and leaders, is that these methods work just as well for the small business as they do for big corporations.
The principles are sound and have been proven in numerous industries, over decades of practice. We look forward to helping you with your challenges, so you can reach the highest goals in your company.
Why Choose Professor Kissinger’s Business Success Puzzle Solutions
Over 100,000+ clients, followers, and students. For over 40+ years, he has helped maximize performance and dramatically increase results
An Extensive selection of coaching, mentoring and training programs: Customised to suit the needs of business owners, managers, sales teams and staff members
We understand Adult Learning: Professor Kissinger with over 17 years of teaching at San Francisco State University and Golden Gate University has taught business owners and entrepreneurs to build businesses, business law, retention, achieving sustained behavoural change and getting a significant return on your investments

Our Promise: We Guarantee Our Results!
Big, medium or small, we will help you achieve your goals faster. Double your sales, decrease costs, attract new talent, innovate, make your workplace great!
Pay-As-You-Go-Pricing 4 Step Coaching System
More flexibility, greater customization, and pay-as-you-go- pricing – our competitors can’t match that.
Step 1. 30-60 Minute Discovery Session
Step 2. 1-3 Day Analysis and Assessment
Step 3. Implementation Coaching, Mentoring and Training
Step 4. Implementation Results Determination
Unlike our competitors, we combine proven coaching and assessments with unmatched customization and superior customer experience. We deliver everything you need without the limitations and restrictions others impose.
Take the NEXT STEP towards
ACHIEVING MORE Success!
Request an Assessment that Works for Your Business
Take your online assessments to the next level with the world’s most trusted assessment technology! You’ll get infinite customizations and an intuitive platform with scientifically validated assessments, exceptional customer support, and flexible pricing plans — perfect for coaches and consultants, corporations and organizations of all sizes.

Reitenbach-Kissinger Institute
Sydney Reitenbach
Michael Kissinger
Text: 650-515-7545
Email: mjkkissinger@yahoo.com
LinkedIn: https://lnkd.in/gE7s99mP
See: Reach Your Peak Performance Results. Embrace Your Unlimited Potential and More. Valued Between from $2,350 to $5,500+
This is a Free event, but you need to Contact us, Qualify and Register for it. mksmasterkeycoaching.com


